AA · SL · Statistics and Probability

Statistics

Sampling Techniques, Mean/Median/Mode, IQR, Quartiles, Outliers, Histograms, Stem/Box Plots, Standard Deviation, Variance, Cumulative Frequency

DifficultyAll difficulties
Exam modePaper 1 & 2

Question 1

MildNo calculator
[Maximum mark: 5]

A college has 360360 day students and 240240 evening students. A researcher needs a stratified random sample of 5050 students.

(a) Find the number to select from each group.[2]

(b) Describe how to select within the groups and explain one benefit over sampling only at lunchtime.[3]
Worked solution

Question 1 mark scheme

(a)

There are 600600 students, so the allocations are 50(360/600)=3050(360/600)=30 day students and 50(240/600)=2050(240/600)=20 evening students.

(b)

Number all students separately in each group and use random numbers to choose 3030 distinct day students and 2020 distinct evening students. Each student within a group then has the same selection chance. Both attendance groups are represented; a lunchtime sample could omit evening students.

Use the mark scheme after attempting the question yourself.

Question 2

MildNo calculator
[Maximum mark: 4]

A survey records the number of emails received yesterday and the time, measured without rounding, taken to complete a task. It recruits volunteers through a study-skills website.

(a) Classify each recorded variable as discrete or continuous.[2]

(b) Explain a likely sampling bias and why a large response count does not remove it.[2]

Worked solution

Question 2 mark scheme

(a)

The email count is discrete because it takes nonnegative integer values. Unrounded completion time is continuous because it can take any value in a time interval.

(b)

People using the study-skills website, and those choosing to respond, may differ systematically from the target population. Increasing the number of volunteers reduces neither the coverage problem nor the self-selection mechanism.

Use the mark scheme after attempting the question yourself.

Question 3

MediumCalculator
[Maximum mark: 5]

A list has 840840 members. A systematic sample of 3535 members is selected using a random start of 1111 and a constant interval.

(a) Find the interval and the first three selected positions.[3]

(b) Find the last selected position and describe one risk if the list has a repeating pattern.[2]

Worked solution

Question 3 mark scheme

(a)

The interval is 840/35=24840/35=24. Starting at 1111 gives positions 11,35,5911,35,59.

(b)

The last position is 11+34(24)=82711+34(24)=827. If a feature of the list repeats every 2424 positions, the sample could repeatedly select the same type of member, making it unrepresentative.

Use the mark scheme after attempting the question yourself.

Question 4

MediumNo calculator
[Maximum mark: 6]

A programme has 200200 campus students and 100100 remote students. Exactly 8080 from each group respond to a survey. The respondent mean travel times are 3030 and 5050 minutes respectively.

(a) Find the unweighted mean of all responses.[2]

(b) Assuming respondents represent their own groups, estimate the population mean using group sizes. Give an exact answer.[2]

(c) Explain why the estimates differ and state a limitation of the weighted estimate.[2]

Worked solution

Question 4 mark scheme

(a)

Equal numbers respond, so the response mean is (80(30)+80(50))/160=40(80(30)+80(50))/160=40 minutes.

(b)

Weighting by enrolment gives tˉ=200(30)+100(50)300=1103 minutes.\bar t=\frac{200(30)+100(50)}{300}=\frac{110}{3}\text{ minutes}.

(c)

Remote students form half the responses but only one third of enrolment, so the unweighted mean overrepresents their longer times. Weighting corrects group proportions but cannot correct differences between respondents and nonrespondents within each group.

Use the mark scheme after attempting the question yourself.

Question 5

SpicyCalculator
[Maximum mark: 10]

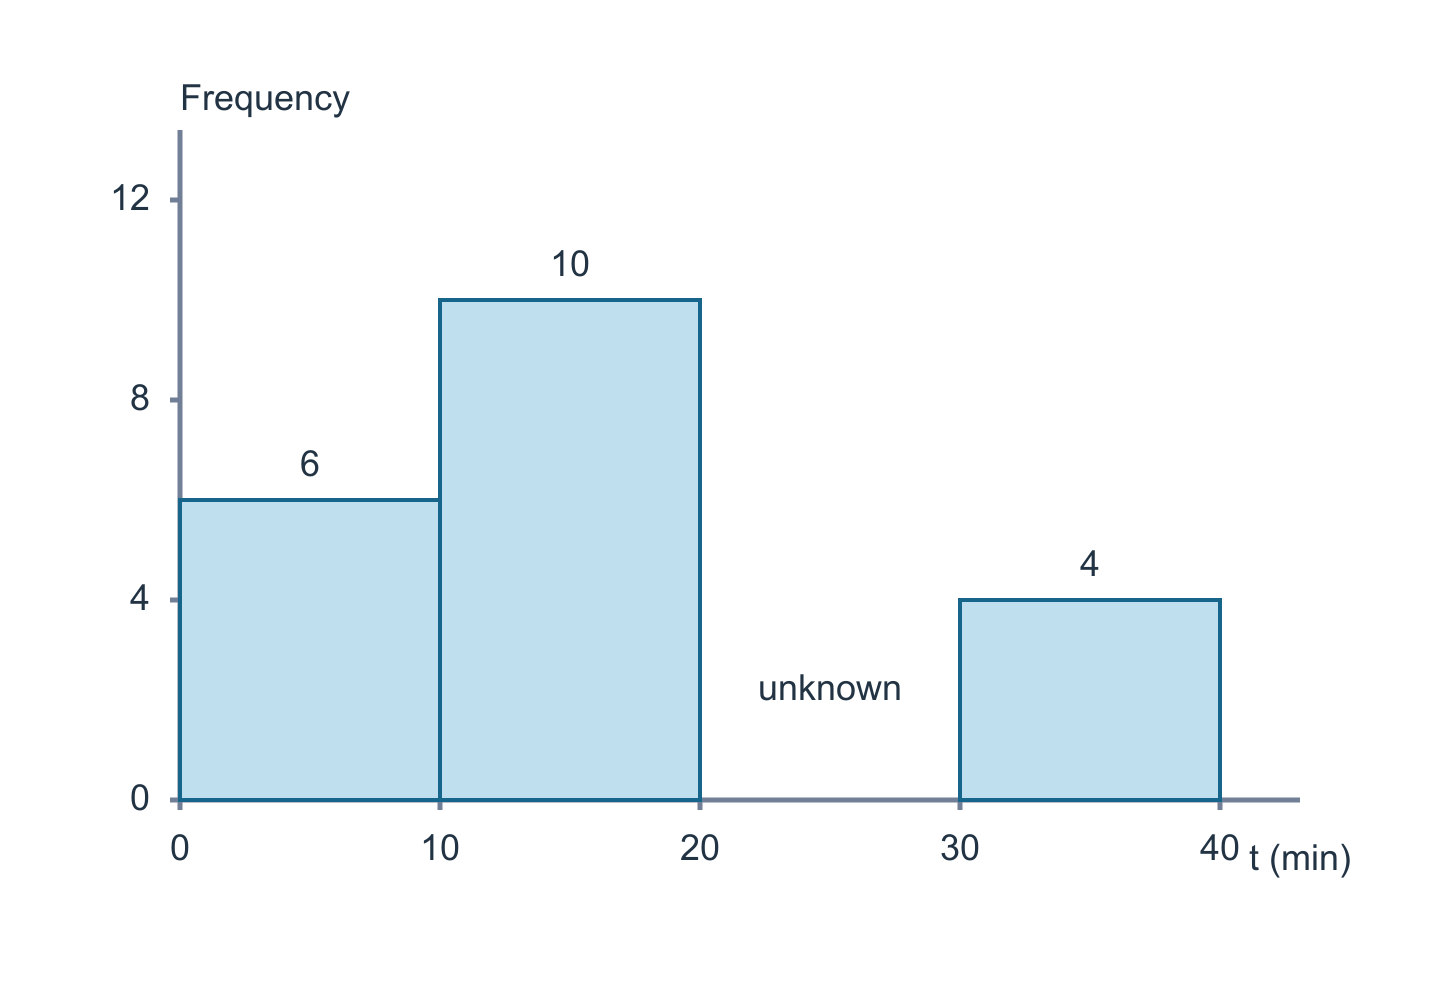
The histogram represents 2828 delivery times in minutes. The four classes have equal width; the height of the third bar is unknown.

Equal-width frequency histogram with one unknown height

(a) Find the missing frequency.[2]

(b) Estimate the mean time using class midpoints, to three significant figures.[3]

(c) State the modal class and explain why the exact mean cannot be recovered.[2]

(d) Estimate the median by linear interpolation within its class. Give your answer to three significant figures.[3]

Worked solution

Question 5 mark scheme

(a)

The known frequencies sum to 6+10+4=206+10+4=20, so the missing frequency is 28−20=828-20=8.

(b)

The midpoints are 5,15,25,355,15,25,35. Therefore tˉ≈6(5)+10(15)+8(25)+4(35)28\bar t\approx\frac{6(5)+10(15)+8(25)+4(35)}{28} =52028=18.5714…≈18.6 minutes.=\frac{520}{28}=18.5714\ldots\approx18.6\text{ minutes}.

(c)

The largest frequency is 1010, so the modal class is 10≤t<2010\leq t<20. Individual times within the intervals are unknown, which prevents calculation of the exact mean.

(d)

There are 66 times below 1010 and 1616 below 2020. The median is at cumulative frequency 1414. Assuming uniform spread in this class, m≈10+14−610(10)=18.0 minutes.m\approx10+\frac{14-6}{10}(10)=18.0\text{ minutes}.

Completed frequency histogram

Use the mark scheme after attempting the question yourself.

Question 6

MildNo calculator
[Maximum mark: 5]

The recorded mean of 2020 scores is 1818. One score was recorded as 1515 instead of its correct value 2525.

(a) Find the corrected total and mean.[3]

(b) Explain whether the correction necessarily changes the median.[2]

Worked solution

Question 6 mark scheme

(a)

The recorded total is 20(18)=36020(18)=360. Replacing 1515 by 2525 adds 1010, giving total 370370 and mean 370/20=18.5370/20=18.5.

(b)

The median depends on the middle positions, not the total. Without the other scores, it is unknown whether this replacement affects either middle position. The median might change or remain unchanged.

Use the mark scheme after attempting the question yourself.

Question 7

MildNo calculator
[Maximum mark: 5]

The ordered scores 2,4,x,8,102,4,x,8,10 have mean 66.

(a) Find xx.[3]

(b) Find the median and state whether there is a mode.[2]

Worked solution

Question 7 mark scheme

(a)

Their total must be 5(6)=305(6)=30, so 2+4+x+8+10=302+4+x+8+10=30 and x=6x=6. This respects the stated order.

(b)

The middle score is 66, so the median is 66. Every score occurs once, so there is no mode.

Use the mark scheme after attempting the question yourself.

Question 8

MediumCalculator
[Maximum mark: 6]

The complete population of five measurements is 12,15,17,19,2212,15,17,19,22.

(a) Find the mean.[2]

(b) Use technology to find the population variance and standard deviation. Give the standard deviation to three significant figures.[3]

(c) Explain why the population, rather than sample, standard deviation is appropriate.[1]

Worked solution

Question 8 mark scheme

(a)

The total is 8585, so the mean is 1717.

(b)

The squared deviations sum to 25+4+0+4+25=5825+4+0+4+25=58. The population variance is 58/5=11.658/5=11.6. Thus σ=11.6=3.405877…≈3.41\sigma=\sqrt{11.6}=3.405877\ldots\approx3.41.

(c)

The five values are specified as the complete population, so the calculation divides by 55, not 44.

Use the mark scheme after attempting the question yourself.

Question 9

MildNo calculator
[Maximum mark: 5]

Group A has 1212 observations with mean 1515. Group B has 1818 observations with mean 2525.

(a) Find the combined mean.[3]

(b) Explain why averaging the two means without weights gives an incorrect result here.[2]

Worked solution

Question 9 mark scheme

(a)

The totals are 12(15)=18012(15)=180 and 18(25)=45018(25)=450. The combined mean is (180+450)/(12+18)=630/30=21(180+450)/(12+18)=630/30=21.

(b)

The two groups have different sizes. The unweighted result 2020 gives the smaller group equal influence, whereas each individual observation should have equal weight.

Use the mark scheme after attempting the question yourself.

Question 10

MediumNo calculator
[Maximum mark: 6]

Measurements xx have mean 4848 and standard deviation 66. They are recoded as y=x−402y=\frac{x-40}{2}.

(a) Find the mean and standard deviation of yy.[3]

(b) Recover the original mean and standard deviation from your answers.[3]

Worked solution

Question 10 mark scheme

(a)

Subtracting 4040 changes the mean to 88 without changing spread. Dividing by 22 gives yˉ=4\bar y=4 and σy=3\sigma_y=3.

(b)

The inverse coding is x=2y+40x=2y+40. Thus xˉ=2(4)+40=48\bar x=2(4)+40=48 and σx=2(3)=6\sigma_x=2(3)=6. Adding a constant does not affect standard deviation.

Use the mark scheme after attempting the question yourself.

Question 11

SpicyCalculator
[Maximum mark: 10]

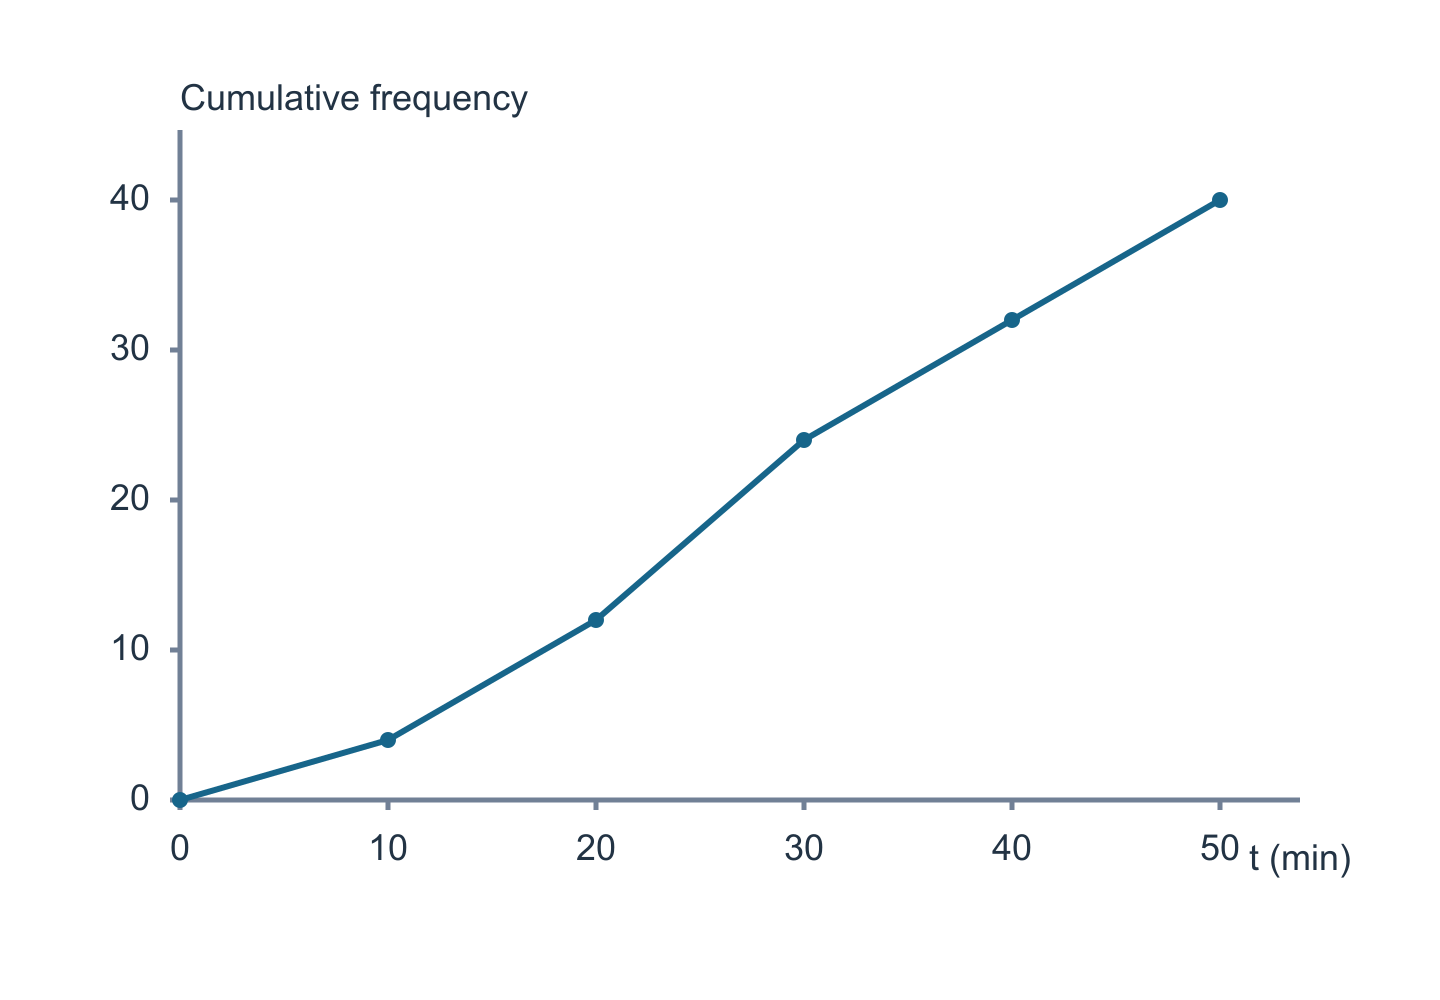
The cumulative-frequency graph represents 4040 waiting times. Join successive plotted points by straight segments when interpolating.

Cumulative-frequency graph for forty waiting times

(a) Estimate the median to three significant figures.[3]

(b) Estimate Q1,Q3Q_1,Q_3 and the IQR.[4]

(c) Estimate how many waiting times exceed 3535 minutes and state the interpolation assumption.[3]

Worked solution

Question 11 mark scheme

(a)

The median has cumulative frequency 2020. Between (20,12)(20,12) and (30,24)(30,24), m=20+20−1224−12(10)=803≈26.7 min.m=20+\frac{20-12}{24-12}(10)=\frac{80}{3}\approx26.7\text{ min}.

(b)

The quartile frequencies are 1010 and 3030. Hence Q1=10+10−412−4(10)=17.5,Q_1=10+\frac{10-4}{12-4}(10)=17.5, Q3=30+30−2432−24(10)=37.5.Q_3=30+\frac{30-24}{32-24}(10)=37.5. The IQR is 37.5−17.5=20.037.5-17.5=20.0 minutes.

(c)

At 3535 minutes, interpolation gives cumulative frequency 24+(5/10)(8)=2824+(5/10)(8)=28. Thus 40−28=1240-28=12 exceed 3535 minutes. This assumes the values are spread uniformly within the relevant class.

Quartile and median guides on the cumulative-frequency graph

Use the mark scheme after attempting the question yourself.

Question 12

MediumCalculator
[Maximum mark: 5]

Masses in grams are grouped as follows.

Mass mm 0≤m<100\leq m<10 10≤m<2010\leq m<20 20≤m<3020\leq m<30
Frequency 5 9 6

(a) Estimate the mean mass, to three significant figures.[3]

(b) State the modal class and explain why this is an estimate of the mean.[2]

Worked solution

Question 12 mark scheme

(a)

Using midpoints 5,15,255,15,25, mˉ≈5(5)+9(15)+6(25)20=15.5 g.\bar m\approx\frac{5(5)+9(15)+6(25)}{20}=15.5\text{ g}.

(b)

The modal class is 10≤m<2010\leq m<20, with frequency 99. The mean calculation replaces each unknown individual value by its class midpoint, so it need not equal the actual mean.

Use the mark scheme after attempting the question yourself.

Question 13

MediumNo calculator
[Maximum mark: 5]

A frequency table has values 1,2,41,2,4 with frequencies 3,k,23,k,2, respectively. Its mean is 2.22.2.

(a) Find kk.[3]

(b) Find the median of the completed data set.[2]

Worked solution

Question 13 mark scheme

(a)

The mean equation is (3+2k+8)/(5+k)=2.2(3+2k+8)/(5+k)=2.2. Hence 11+2k=11+2.2k11+2k=11+2.2k, so k=0k=0. A zero frequency is allowed.

(b)

The completed list is 1,1,1,4,41,1,1,4,4. Its middle value is 11, so the median is 11.

Use the mark scheme after attempting the question yourself.

Question 14

MediumCalculator
[Maximum mark: 6]

A cumulative-frequency table for 8080 observations gives F(20)=18F(20)=18 and F(30)=42F(30)=42. Assume linear interpolation between these boundaries.

(a) Estimate the 4040th percentile.[3]

(b) Estimate the percentage below 2525 and explain why the two requested quantities have different units.[3]

Worked solution

Question 14 mark scheme

(a)

The percentile has cumulative frequency 0.40(80)=320.40(80)=32. Therefore P40=20+32−1842−18(10)=25.8333…≈25.8.P_{40}=20+\frac{32-18}{42-18}(10)=25.8333\ldots\approx25.8.

(b)

At 2525, the estimated cumulative frequency is 18+(5/10)(24)=3018+(5/10)(24)=30, giving 100(30/80)=37.5%100(30/80)=37.5\%. A percentile value has the units of the measured variable; a percentage is a dimensionless proportion of the observations.

Use the mark scheme after attempting the question yourself.

Question 15

MediumCalculator
[Maximum mark: 6]

Two classes record completion times in minutes using the same intervals.

Time 0≤t<100\leq t<10 10≤t<2010\leq t<20 20≤t<3020\leq t<30
Class A 4 12 4
Class B 8 4 8

(a) Estimate both means and population standard deviations using midpoints. Give standard deviations to three significant figures.[4]

(b) Compare typical time and spread under this approximation.[2]

Worked solution

Question 15 mark scheme

(a)

Both midpoint-weighted totals are 300300, with 2020 observations each, so both estimated means are 1515 minutes. For A, squared deviations from 1515 sum to 4(100)+12(0)+4(100)=8004(100)+12(0)+4(100)=800, giving σA=800/20=40≈6.32\sigma_A=\sqrt{800/20}=\sqrt{40}\approx6.32. For B the sum is 8(100)+4(0)+8(100)=16008(100)+4(0)+8(100)=1600, giving σB=80≈8.94\sigma_B=\sqrt{80}\approx8.94 minutes.

(b)

The estimated average times are equal, but B is more dispersed: it places more observations in the outer intervals. These conclusions use midpoint approximations.

Use the mark scheme after attempting the question yourself.

Question 16

SpicyNo calculator
[Maximum mark: 10]

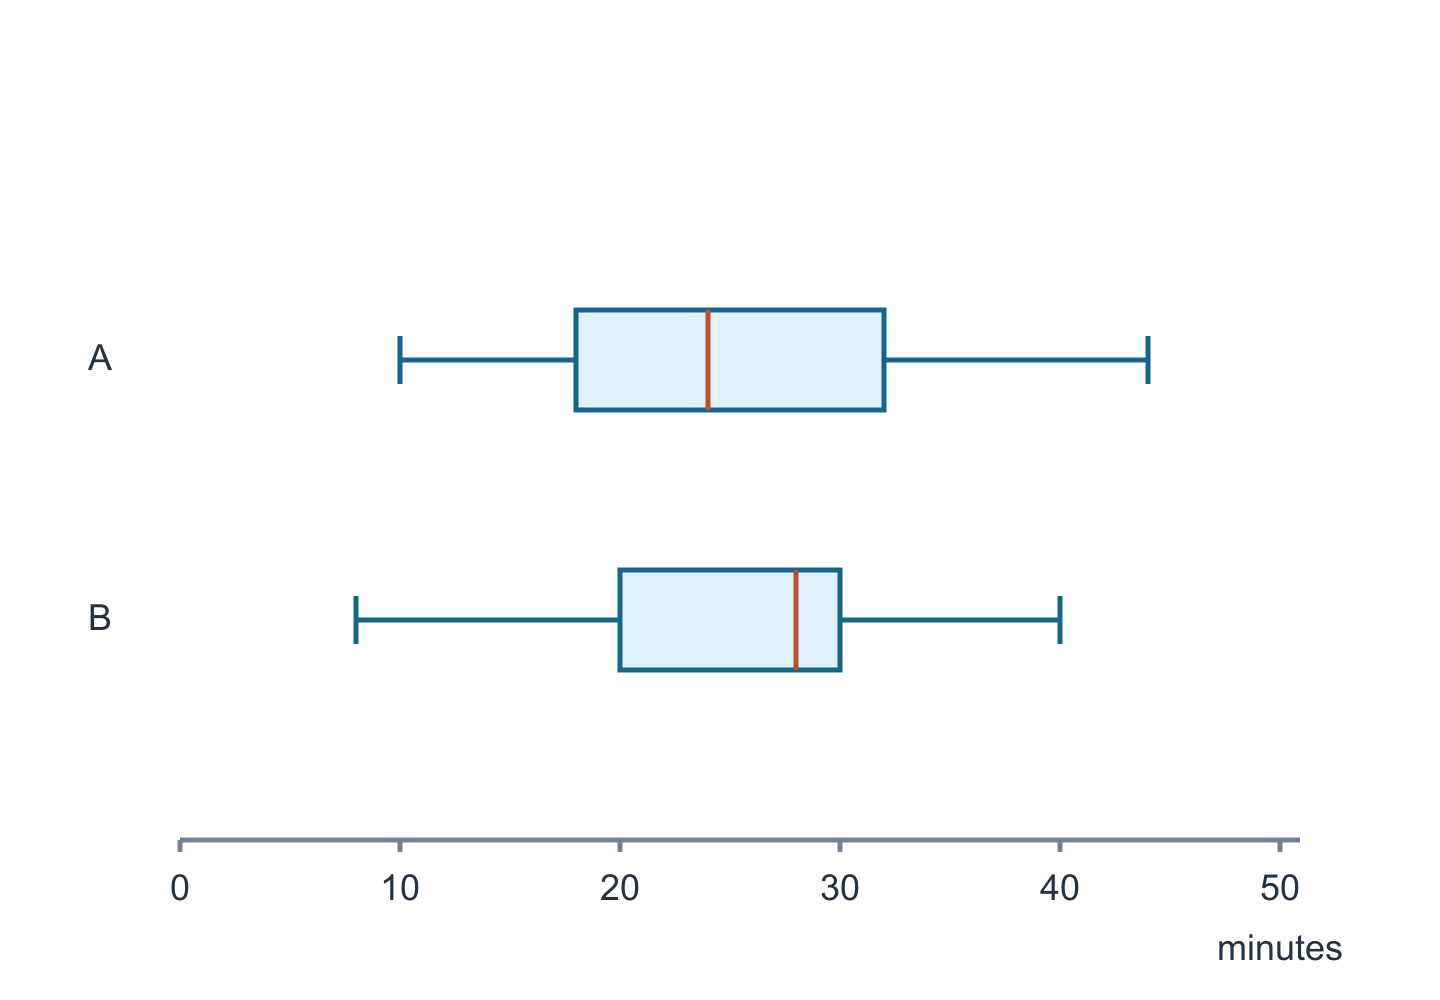
The box plots summarize two groups of journey times in minutes. The five-number summaries are A: (10,18,24,32,44)(10,18,24,32,44) and B: (8,20,28,30,40)(8,20,28,30,40). Whiskers show the smallest and largest observations; no original observations are outliers.

Box plots for two journey-time groups on the same scale

(a) Compare medians and IQRs.[4]

(b) Compare ranges and explain why the means cannot be determined.[3]

(c) Using B's original quartiles, determine whether an additional observation of 4848 would be flagged as an outlier.[3]

Worked solution

Question 16 mark scheme

(a)

A's median is 2424 and B's is 2828, so B has the higher central journey time. Their IQRs are 32−18=1432-18=14 and 30−20=1030-20=10 minutes; B's middle half is less spread out.

(b)

The ranges are 44−10=3444-10=34 for A and 40−8=3240-8=32 for B. A has a slightly larger total spread. Five-number summaries do not specify every value or their sum, so they do not determine the means.

(c)

B's upper fence is 30+1.5(10)=4530+1.5(10)=45. Since 48>4548>45, the added observation would be flagged using those original quartiles.

Box plots annotated with their interquartile ranges

Use the mark scheme after attempting the question yourself.

Question 17

MildNo calculator
[Maximum mark: 5]

For the ordered list 1,3,5,7,9,11,131,3,5,7,9,11,13, define quartiles as the medians of the lower and upper halves after excluding the overall median.

(a) Find the median and quartiles.[3]

(b) Explain why stating a quartile convention matters for small data sets.[2]

Worked solution

Question 17 mark scheme

(a)

The median is 77. Excluding it leaves lower half 1,3,51,3,5 and upper half 9,11,139,11,13, so Q1=3Q_1=3 and Q3=11Q_3=11.

(b)

Some methods include or interpolate around the central value differently. With few observations this can change the reported quartiles, even when both methods use the same ordered data.

Use the mark scheme after attempting the question yourself.

Question 18

MediumNo calculator
[Maximum mark: 6]

A sample has Q1=18Q_1=18 and Q3=30Q_3=30. Use the rule that an outlier lies more than 1.51.5 IQR beyond a quartile.

(a) Find both fences.[3]

(b) Classify observations 0,−1,48,490,-1,48,49 and explain the boundary cases.[3]

Worked solution

Question 18 mark scheme

(a)

The IQR is 30−18=1230-18=12, so 1.5 IQR=181.5\text{ IQR}=18. The lower and upper fences are 18−18=018-18=0 and 30+18=4830+18=48.

(b)

The values −1-1 and 4949 lie beyond the fences and are outliers. The values 00 and 4848 equal the fences, so they are not outliers: the rule says more than 1.51.5 IQR, not at least.

Use the mark scheme after attempting the question yourself.

Question 19

MediumNo calculator
[Maximum mark: 6]

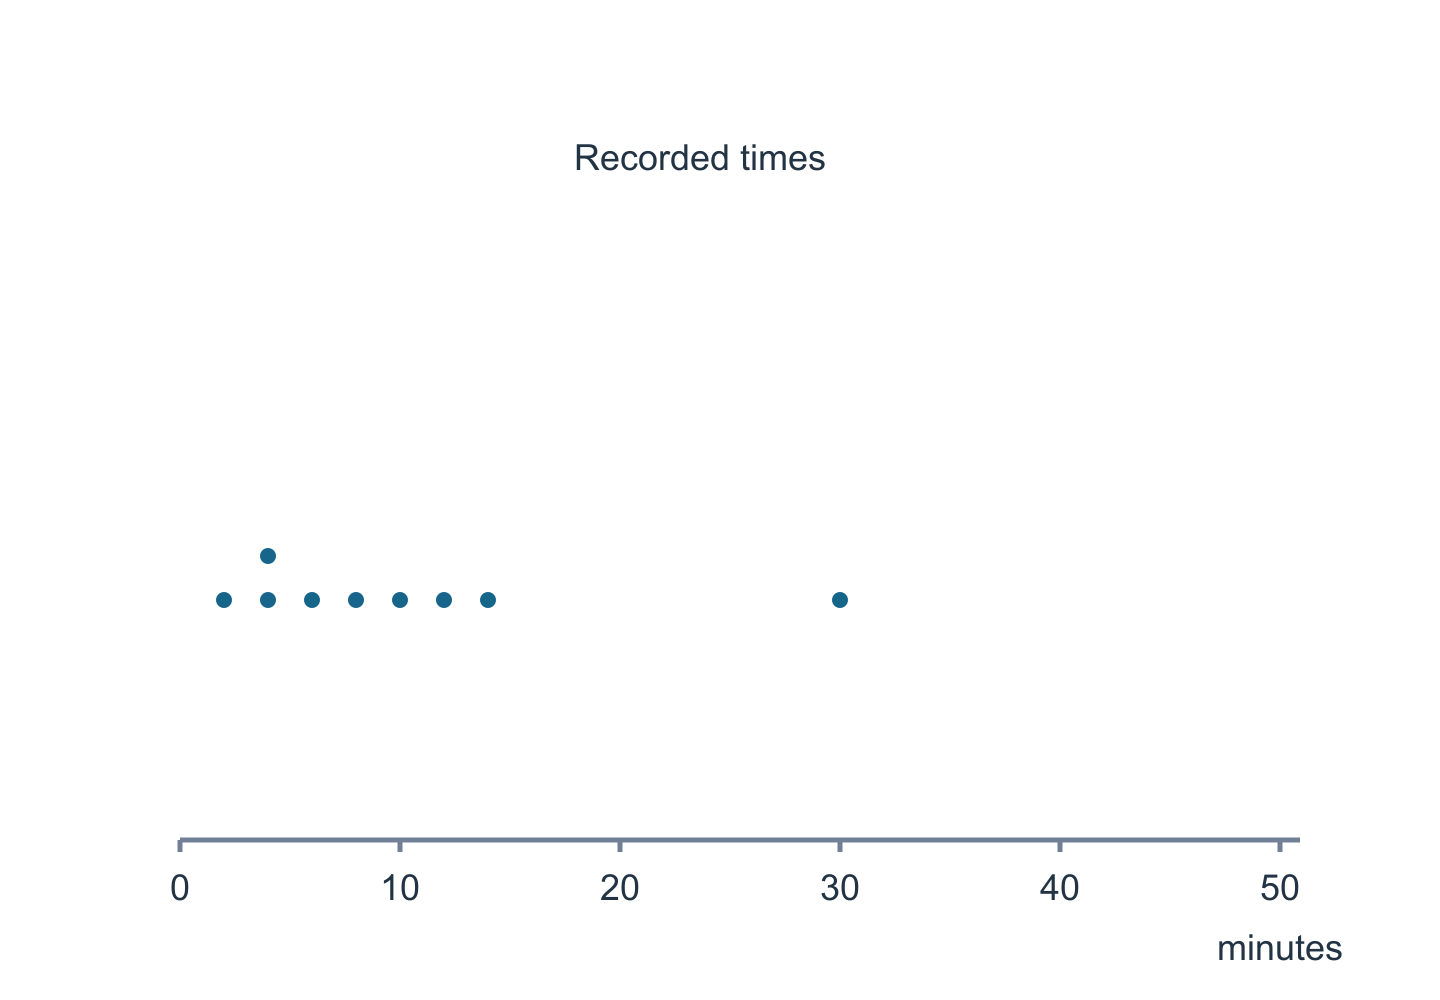
Nine recorded times are 2,4,4,6,8,10,12,14,302,4,4,6,8,10,12,14,30 minutes, shown in the dot plot. Exclude the overall median when finding the lower- and upper-half medians.

Dot plot of nine recorded times

(a) Find the median, quartiles and IQR.[3]

(b) Identify outliers and specify the whisker endpoints of a modified box plot.[3]

Worked solution

Question 19 mark scheme

(a)

The median is the fifth value, 88. The lower half is 2,4,4,62,4,4,6, giving Q1=4Q_1=4. The upper half is 10,12,14,3010,12,14,30, giving Q3=13Q_3=13. Thus the IQR is 99 minutes.

(b)

The fences are 4−1.5(9)=−9.54-1.5(9)=-9.5 and 13+1.5(9)=26.513+1.5(9)=26.5. Only 3030 is an outlier. The whiskers extend to the most extreme nonoutliers, 22 and 1414, and 3030 is shown separately with a cross.

Modified box plot with the outlier shown separately

Use the mark scheme after attempting the question yourself.

Question 20

SpicyCalculator
[Maximum mark: 10]

For a population of 1010 values, the recorded summaries are ∑x=100\sum x=100 and ∑x2=1300\sum x^2=1300. A value recorded as 2020 should have been 1010.

(a) Correct both summaries.[3]

(b) Find the corrected mean, population variance and standard deviation. Give the standard deviation to three significant figures.[4]

(c) Compare the recorded and corrected spreads and explain why correcting only ∑x\sum x would be invalid.[3]

Worked solution

Question 20 mark scheme

(a)

The corrected sum is 100−20+10=90100-20+10=90. The corrected squared sum is 1300−202+102=10001300-20^2+10^2=1000.

(b)

The corrected mean is 90/10=990/10=9. The population variance is 1000/10−92=191000/10-9^2=19, so σ=19≈4.36\sigma=\sqrt{19}\approx4.36.

(c)

The recorded variance was 1300/10−102=301300/10-10^2=30, with standard deviation 30≈5.48\sqrt{30}\approx5.48. The correction reduces spread. Replacing a value changes both its contribution to the sum and its squared contribution; retaining the old squared sum would describe a different, inconsistent data set.

Use the mark scheme after attempting the question yourself.

Question 21

SpicyCalculator
[Maximum mark: 10]

The ordered values 8,10,12,14,16,18,20,M8,10,12,14,16,18,20,M have mean 1818.

(a) Find MM.[3]

(b) Remove the smallest and largest values and find the trimmed mean.[2]

(c) Use technology to find the population standard deviations before and after trimming, to three significant figures.[3]

(d) Explain what the comparison illustrates about sensitivity to extreme observations.[2]

Worked solution

Question 21 mark scheme

(a)

The first seven sum to 9898. Thus 98+M=8(18)=14498+M=8(18)=144, giving M=46M=46, consistent with the order.

(b)

Removing 88 and 4646 leaves total 9090 across six values, so the trimmed mean is 1515.

(c)

Before trimming, ∑x2=3600\sum x^2=3600, giving variance 3600/8−182=1263600/8-18^2=126 and standard deviation 126≈11.2\sqrt{126}\approx11.2. After trimming, the squared deviations from 1515 sum to 25+9+1+1+9+25=7025+9+1+1+9+25=70, giving standard deviation 70/6≈3.42\sqrt{70/6}\approx3.42.

(d)

Removing the extremes lowers the mean from 1818 to 1515 and greatly reduces standard deviation. The high observation 4646 had substantial influence on both the average and measured spread; trimming changes the population being summarized.

Use the mark scheme after attempting the question yourself.

Question 22

MildCalculator
[Maximum mark: 6]

An organisation has 12001200 members, but its email sampling frame lists only 960960. It randomly emails 6060 listed members, of whom 4545 respond.

(a) Calculate the frame coverage and response rate as percentages.[3]

(b) Name the two distinct potential sources of bias and explain why random selection from the frame does not remove them.[3]

Worked solution

Question 22 mark scheme

(a)

Frame coverage is 100(960/1200)=80%100(960/1200)=80\%. The response rate among those contacted is 100(45/60)=75%100(45/60)=75\%.

(b)

Undercoverage arises because 240240 members cannot be selected. Nonresponse bias may arise if the 1515 nonrespondents differ from respondents. Random selection gives a fair draw among listed members, but it neither includes omitted members nor makes response random.

Use the mark scheme after attempting the question yourself.