Question 1
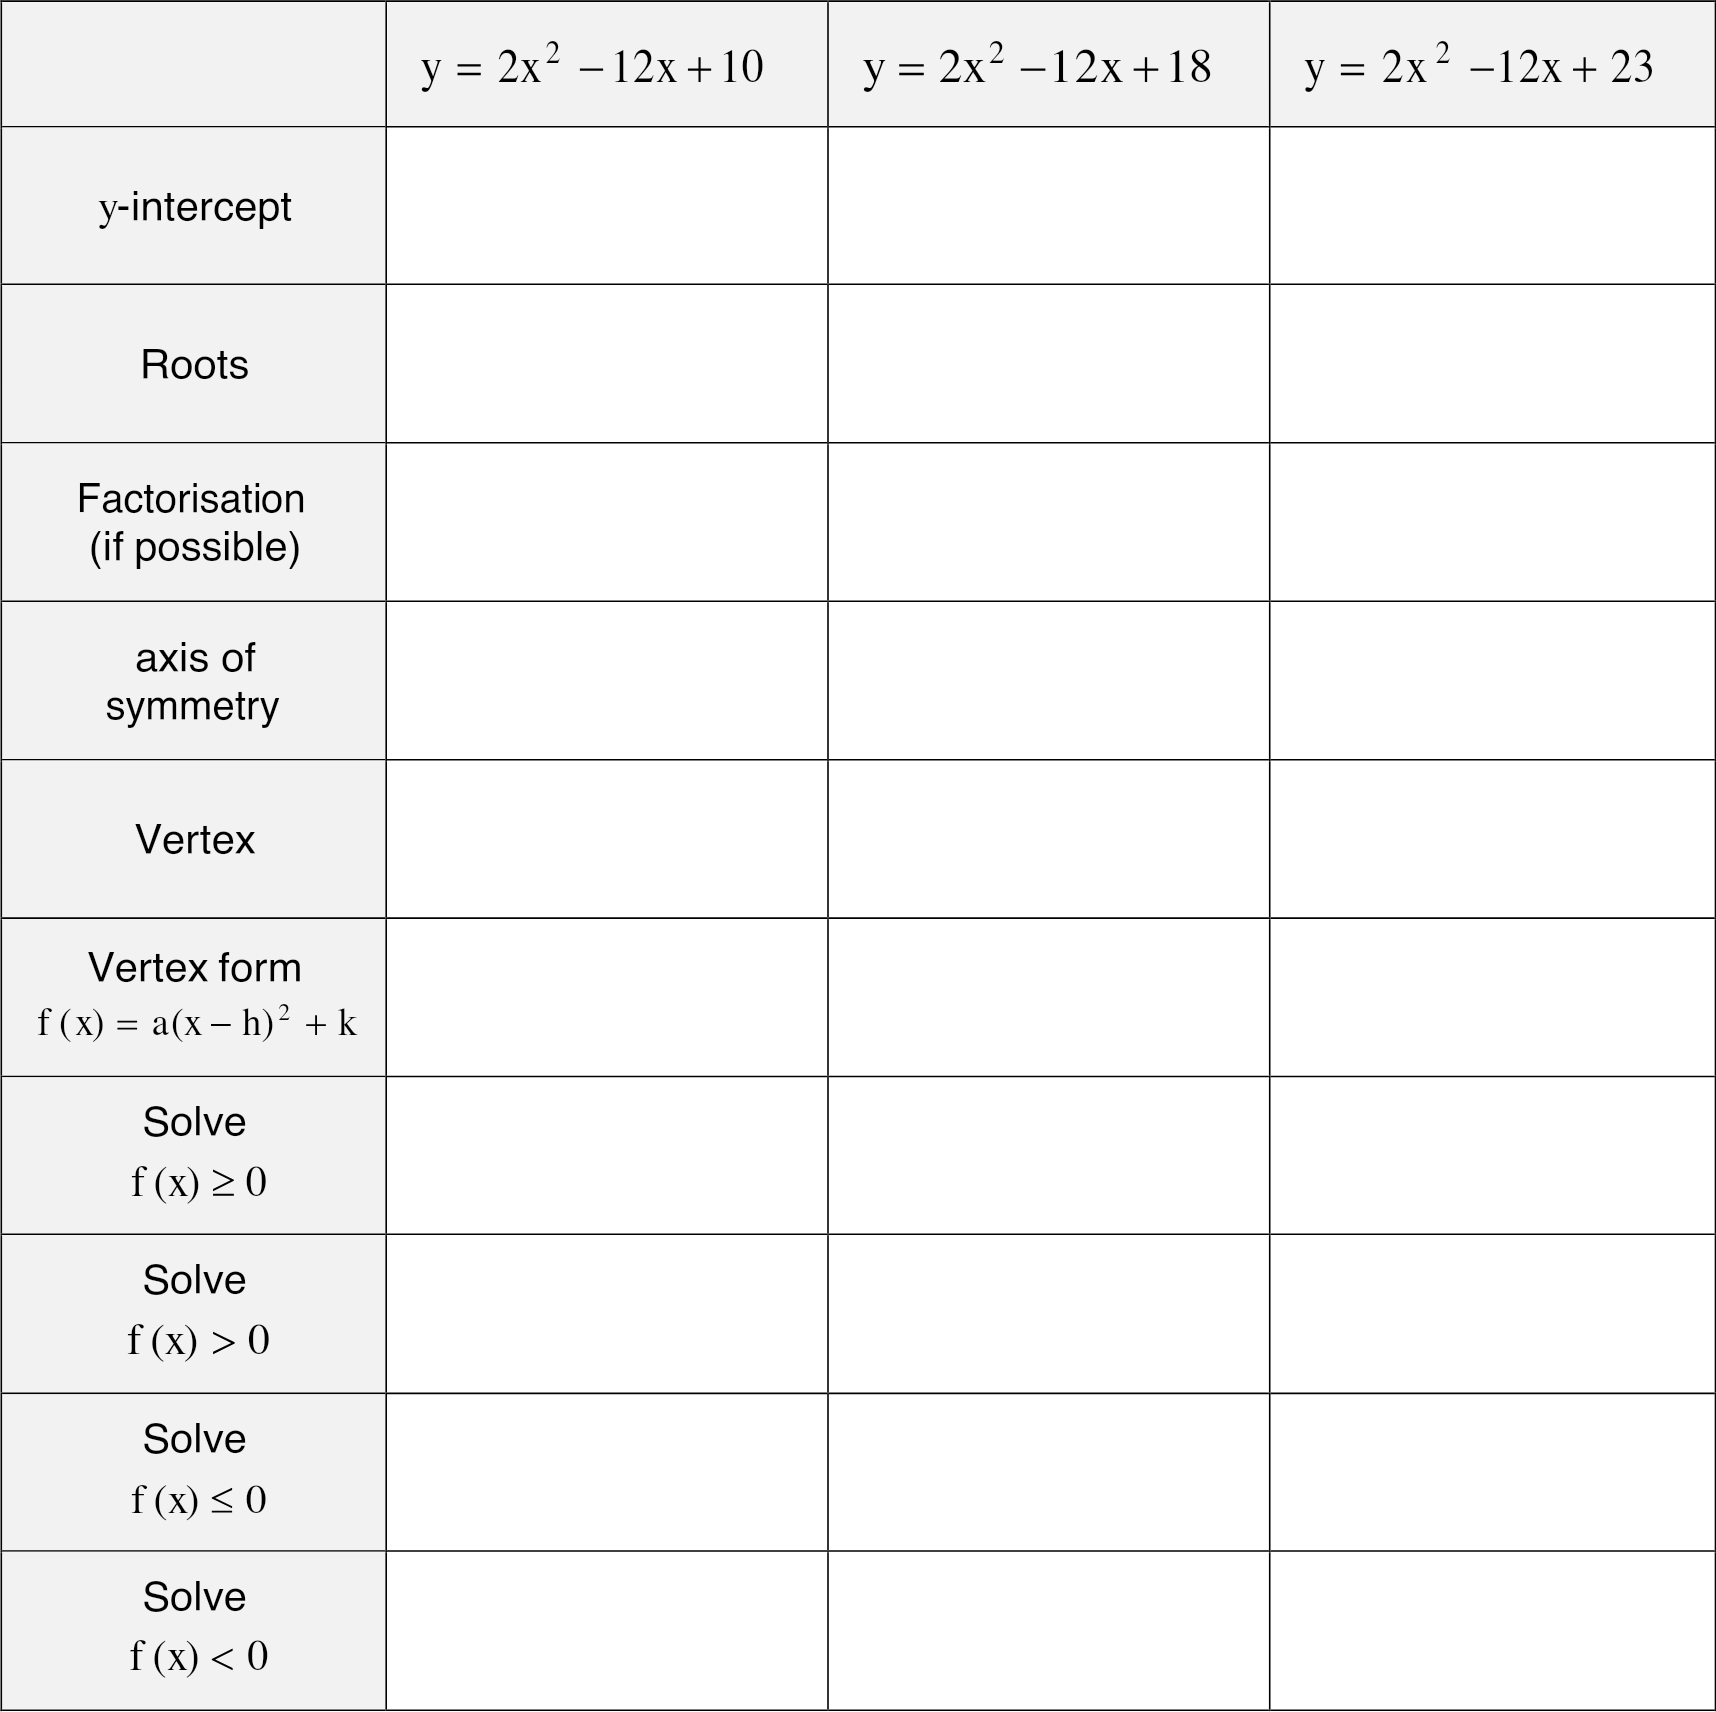
SpicyNo calculatorComplete the following table for the three quadratic functions below

Standard Level · Functions
Linear equations, gradients and straight-line graphs, Key Features, Forms of equations, Quadratic Formula, Discriminant, Equations, Inequalities
Complete the following table for the three quadratic functions below
Consider the quadratic
(a) (i) Find the roots.
(ii) Hence express the quadratic in the form [3]
(b) (i) Find the coordinates of the vertex.
(ii) Hence express the quadratic in the form
(iii) Write down the equation of the axis of symmetry
(iv) Write down the minimum value of [5]
(c) Write down the -intercept of the quadratic[1]
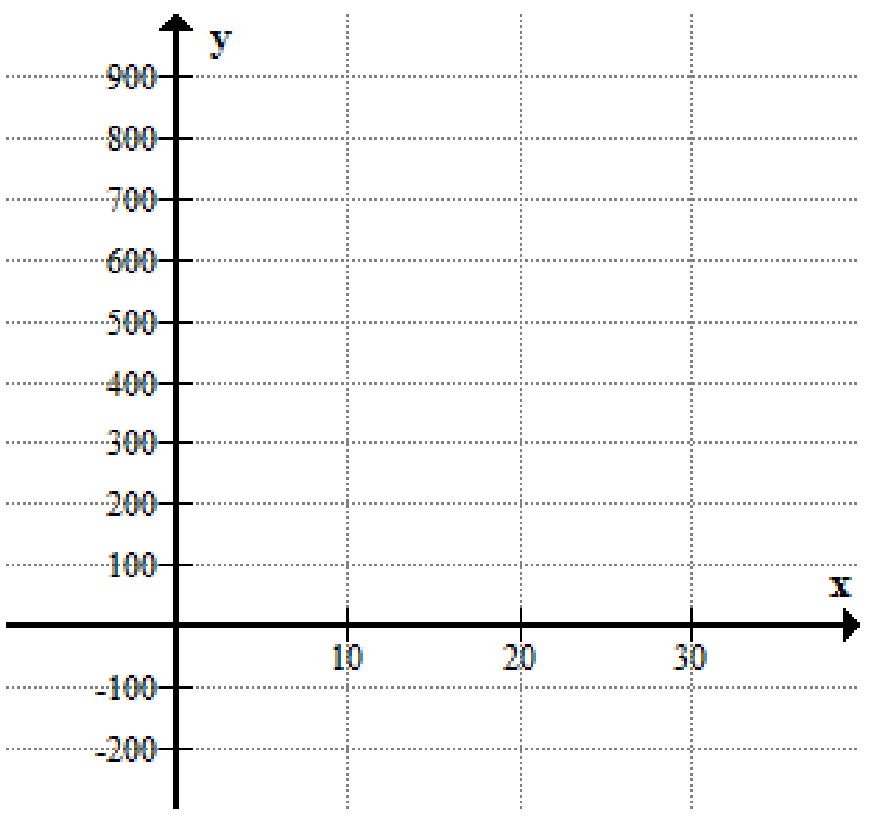
(d) Draw the graph of the quadratic on the diagram below.[3]
Consider the quadratic
(a) (i) Find the roots.
(ii) Hence express the quadratic in the form [3]
(b) (i) Find the coordinates of the vertex.
(ii) Hence express the quadratic in the form
(iii) Write down the equation of the axis of symmetry
(iv) Write down the maximum value of [5]
(c) Write down the -intercept of the quadratic[1]
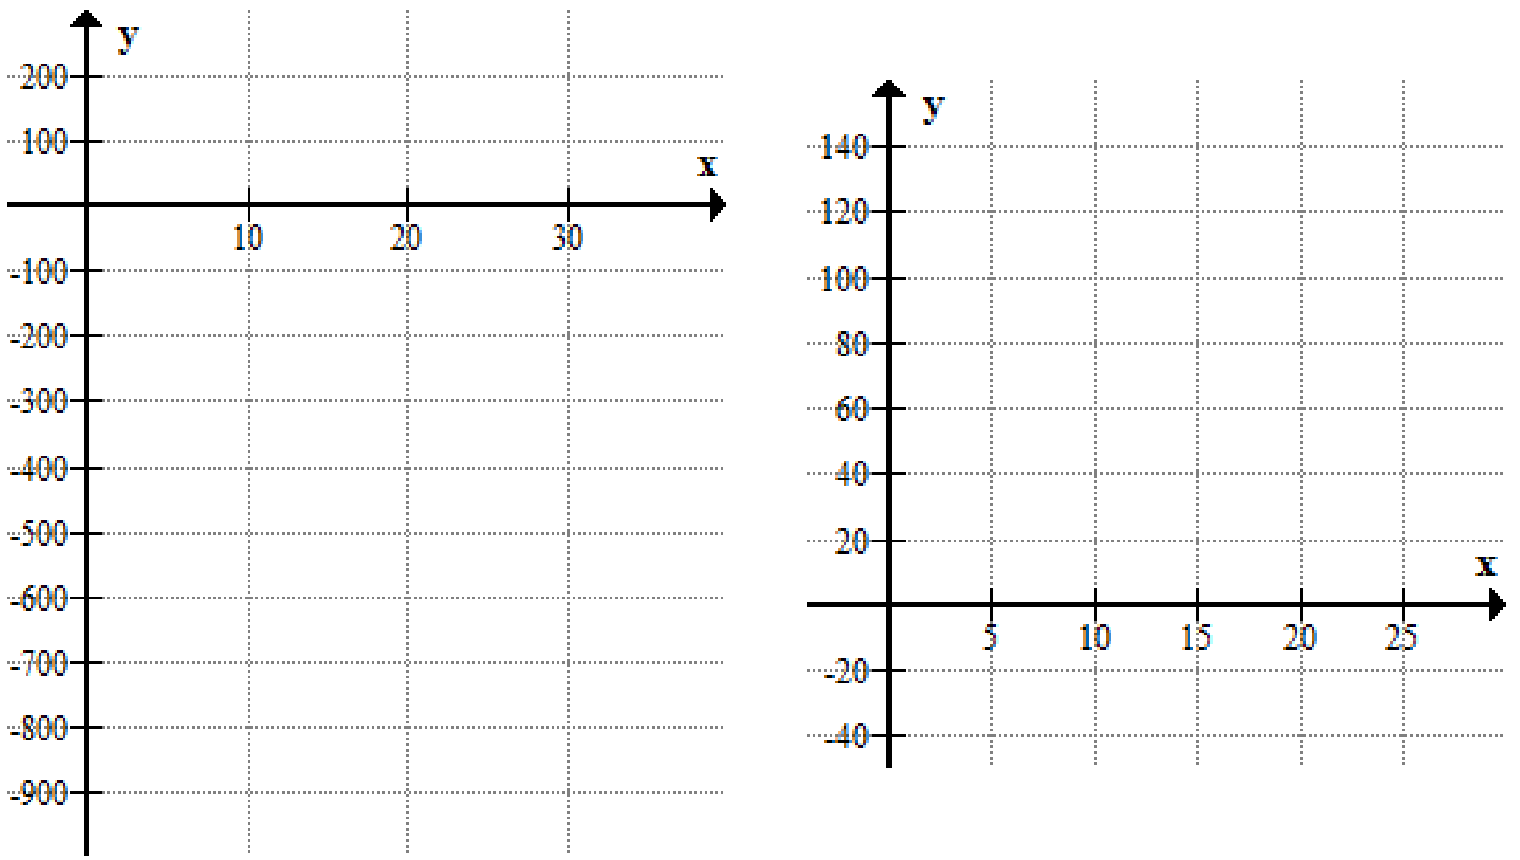
(d) Draw the graph of the quadratic on each of the diagrams below.[5]
The parabola of a quadratic is shown below. The -intercepts are and .
The -intercept is . The curve passes through the point A(7,5).
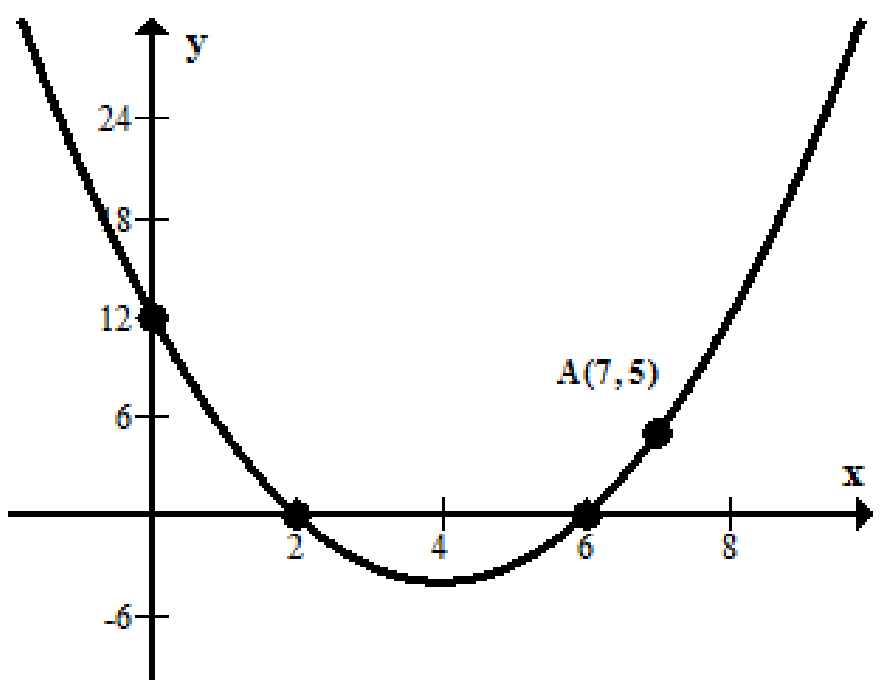
Without finding the equation of the curve and by just using the symmetry of the graph
(a) Write down the equation of the axis of symmetry.[1]
(b) Find the value of for . Justify your answer.[2]
(c) Find the value of for . Justify your answer.[2]
(a) Solve the equation .[2]
(b) Factorize .[2]
The diagram represents the graph of the function .
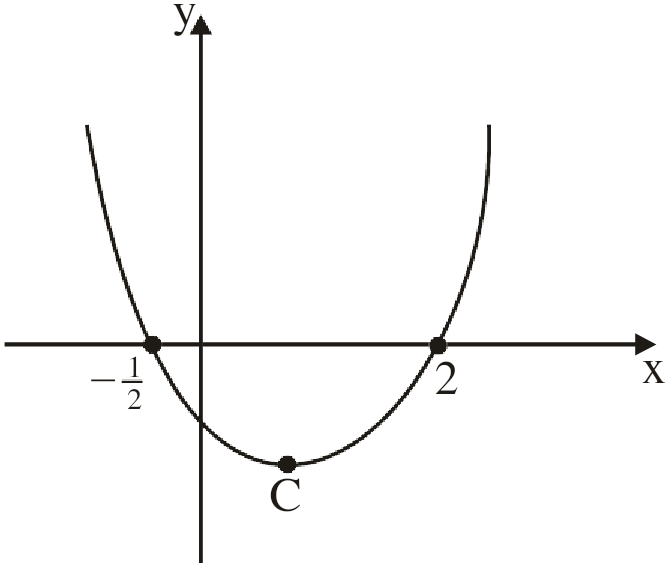
(a) Write down the values of p and q.[2]
(b) The function has a minimum value at the point C. Find the x-coordinate of C.[2]
The following diagram shows part of the graph of f, where .
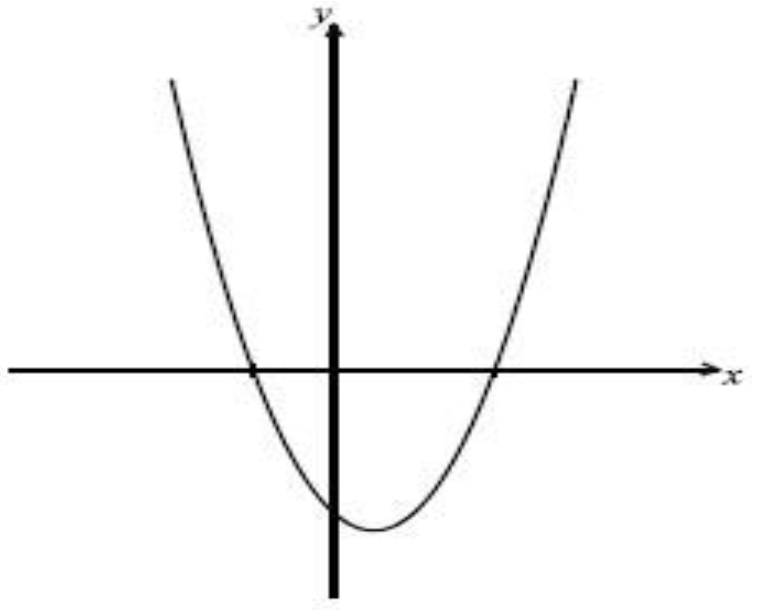
(a) Find both x-intercepts.[2]
(b) Find the x-coordinate of the vertex.[2]
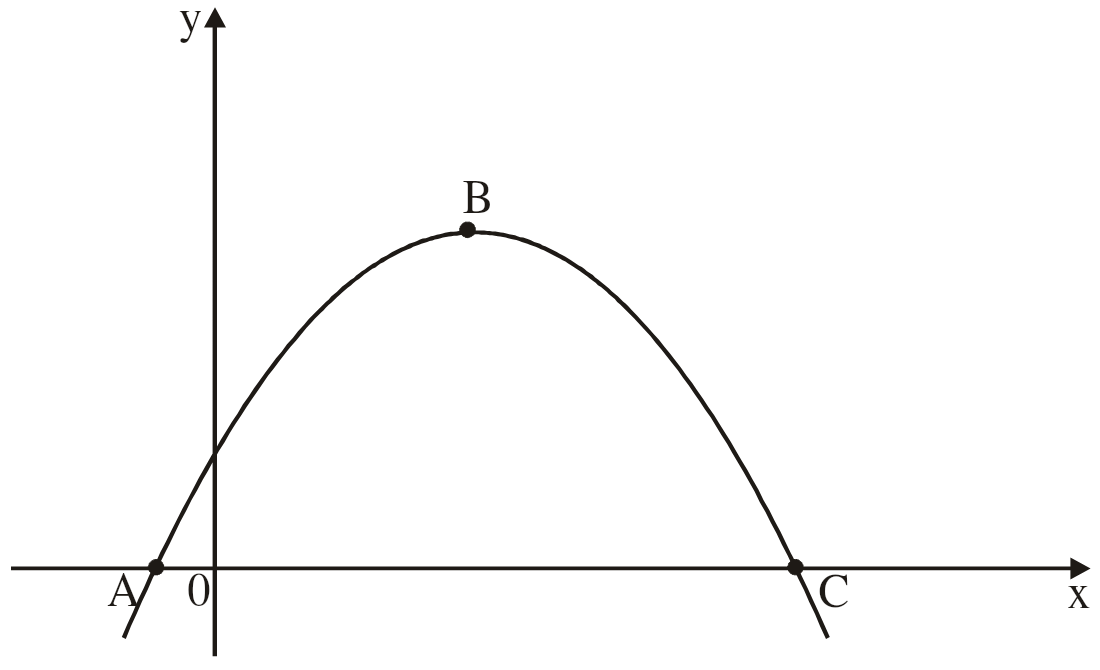
The diagram shows the parabola . The points A, C are the x-intercepts and the point B is the maximum point. Find the coordinates of A, B and C.
Let . Part of the graph of f is shown below.
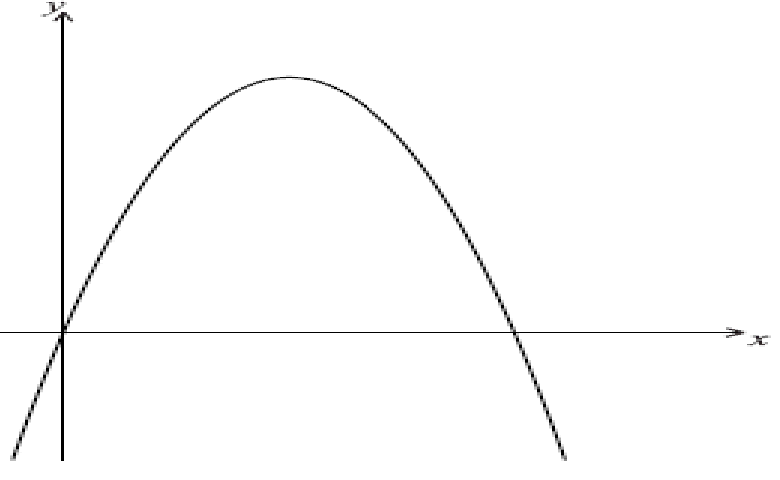
(a) Find the x-intercepts of the graph.[4]
(b) (i) Write down the equation of the axis of symmetry.
(ii) Find the y-coordinate of the vertex.[3]
The following diagram shows the graph of function .
Complete the table next to the graph to show whether each expression is positive (+), negative (-) or zero (0).
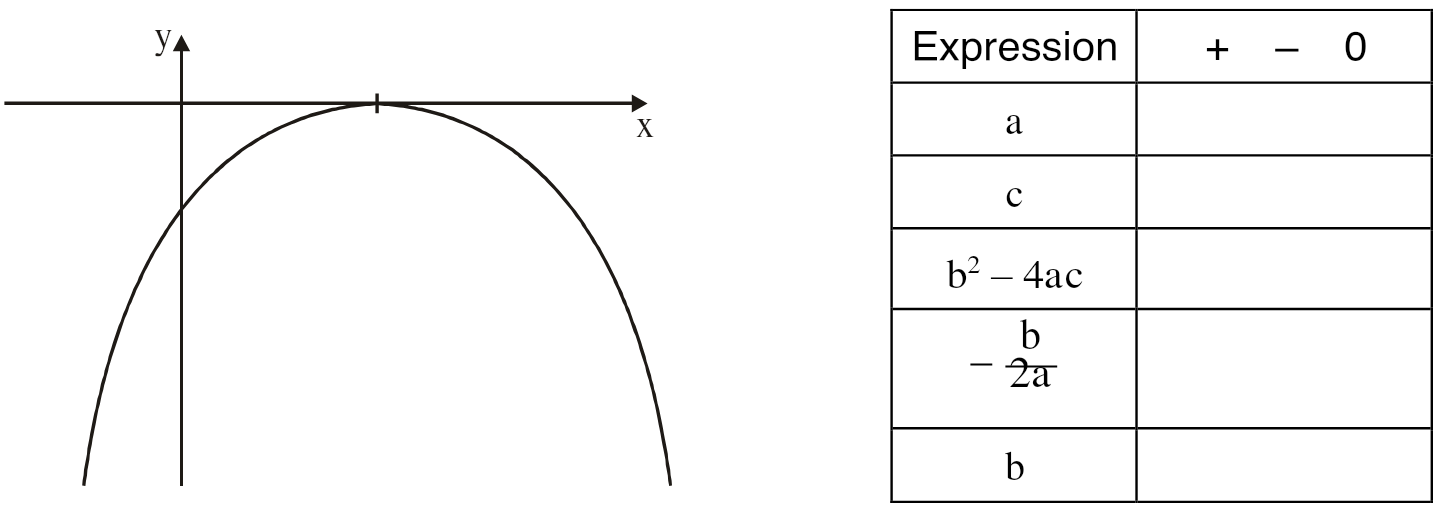
The following diagram shows the graph of function .
Complete the table next to the graph to show whether each expression is positive (+), negative (-) or zero (0).
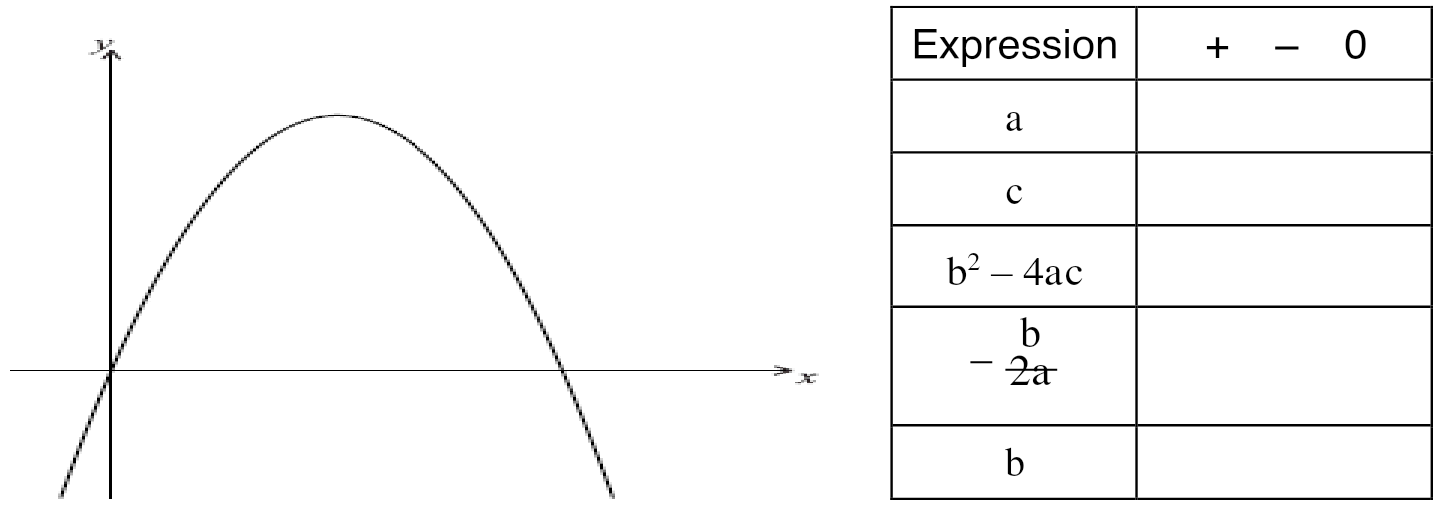
The following diagram shows the graph of function .
Complete the table next to the graph to show whether each expression is positive (+), negative (-) or zero (0).
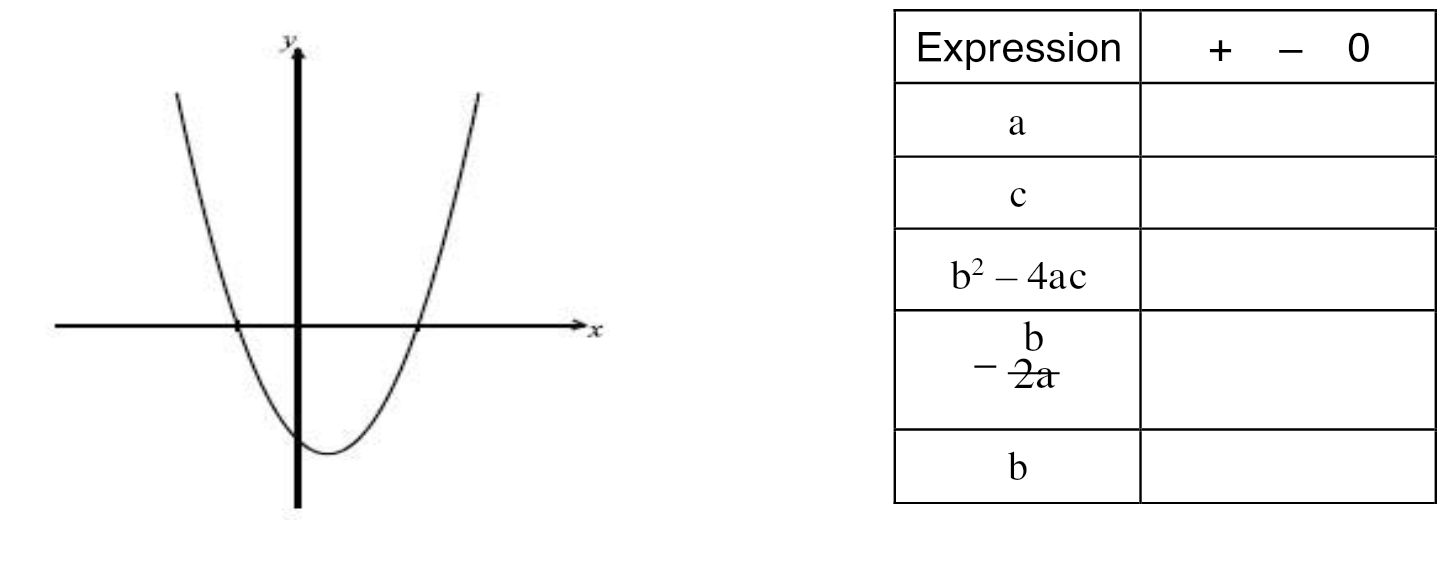
(a) Find the vertex of [2]
(b) Express the function in the form [2]
Consider the function .
(a) Express in the form , where .[3]
(b) Find the minimum value of .[1]
(a) Find the vertex of [2]
(b) Express the function in the form [2]
(a) Find the vertex of [2]
(b) Express the function in the form [2]
Find the points of intersection between and and sketch a graph to demonstrate the result.
Find the point of intersection between and and sketch a graph to demonstrate the result.
Find the points of intersection (if any) between and and sketch a graph to demonstrate the result.
Find the points of intersection (if any) between and and sketch a graph to demonstrate the result.